ABA Treasurer's Report for FY19

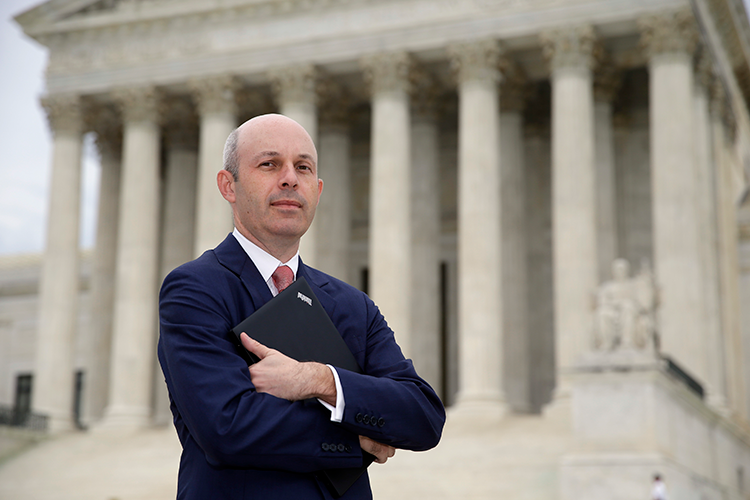
Photo courtesy of Michelle Behnke/Shutterstock
Each year, the treasurer provides a report on the association’s finances that is printed here in the ABA Journal. This year, as I began to prepare this report, the spread of COVID-19 was on the rise. At this time, it is too early to quantify or report on the financial impact of the pandemic on the association. However, you should know that your ABA financial services team is working hard to mitigate losses so that the association can use its resources to help members, the courts and the public during this unprecedented time. So although this report is being prepared at an extraordinary time, it will be a fairly traditional report.
This report will cover fiscal year 2019 results as audited by Grant Thornton. I will then reflect on operating trends seen during my three-year tenure serving as your ABA treasurer, and lastly, I will discuss looking forward to the fiscal 2021 budget and beyond.
Year-end audit and financial results
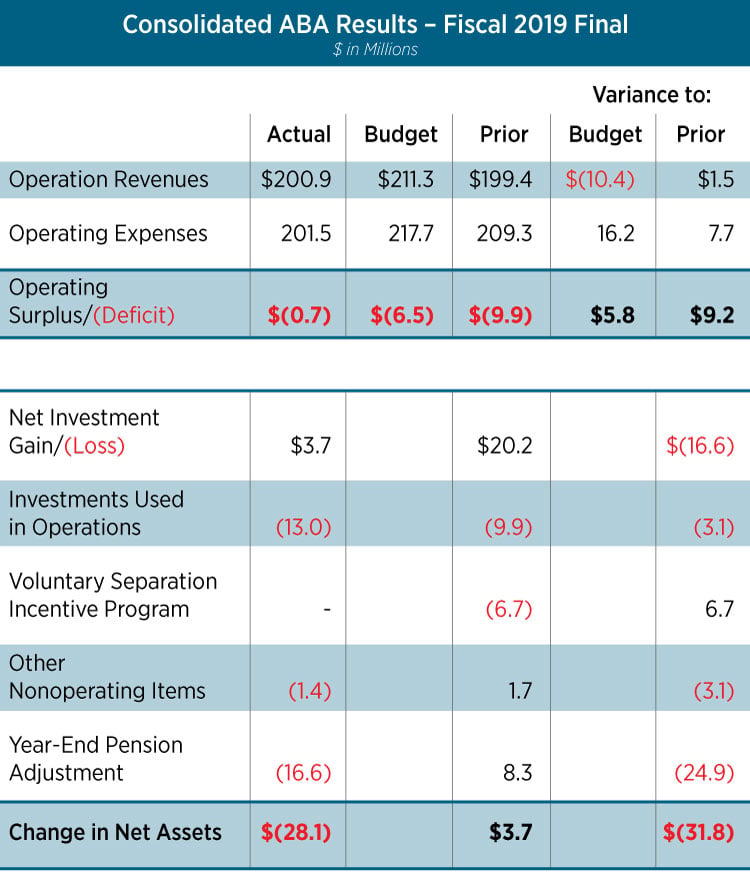
Chart by Sara Wadford
Grant Thornton issued an unqualified audit opinion for the fiscal year ended Aug. 31, 2019, that includes an audit of our government grants. The audit was accepted by the Board of Governors at its meeting on Feb. 14, 2020.
The following is a summary from the audit report. You can visit ABAJournal.com/audited_results for the complete ABA financial statements and audit report.
As you can see in our consolidated ABA results through August 2019, operations resulted in a deficit of $0.7 million, which was $5.8 million favorable to budget and $9.2 million favorable to prior year’s operating deficit. Operating expenses came in $16.2 million favorable to budget, consistent with prior year and reflective of diligent expense management. However, operating revenues fell $10.4 million short of budgeted revenue. (See Consolidated ABA Results table below.)
The $10.4 million operating revenue shortfall is driven by softness in both dues ($3.5 million) and nondues revenue ($4.3 million). Nondues revenue is unfavorable to budget in meeting fees, grants, publications, advertising, and contributions and sponsorships. The remaining $2.6 million shortfall relates to the amount of investment income used to support operations. The use of investment income to support the value proposition is drawn only as the expenses are incurred, so this reduction in the use of investments really reflects the fact that the association did not incur as much in the expense line as expected for the value proposition. More than offsetting revenue shortfalls to budget are favorable expenses in nearly all reporting lines.
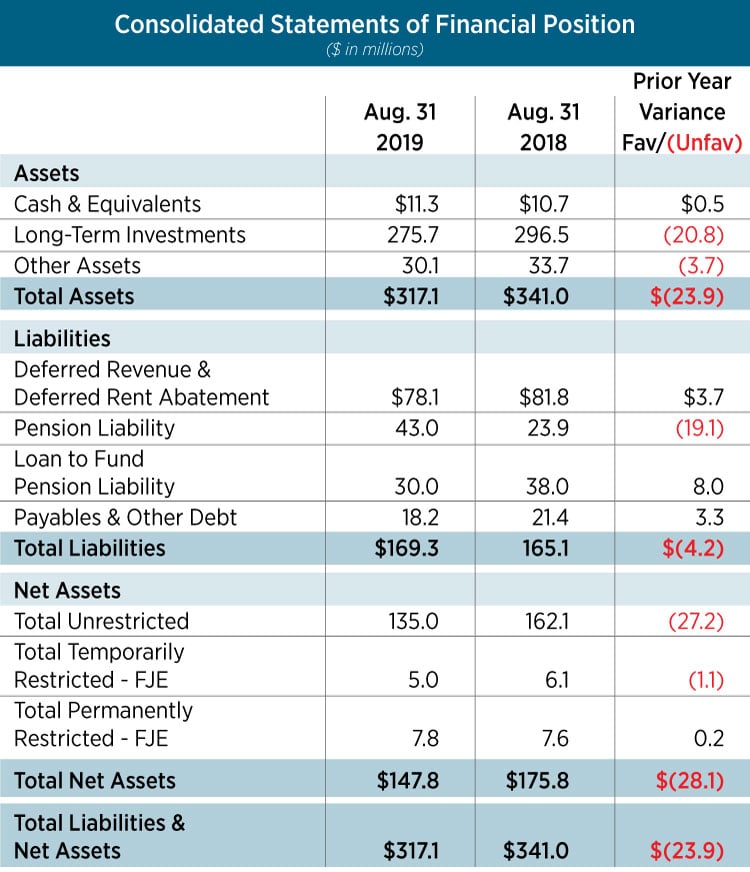
Chart by Sara Wadford
Although operations resulted in a modest deficit of $0.7 million, our net assets declined $28.1 million. Below the line, we saw below-average investment performance (only $3.7 million in investment income due to market timing) and we used $13 million in investment income to support operations and launch the value proposition. Additionally, our year-end pension adjustment accounts for $16.6 million of the decrease to net assets. I will speak more to the impact our pension has on our results and balance sheet later in this report. (See Consolidated Statements of Financial Position table, page 25.)
At the close of fiscal 2019, the association had $317.1 million in assets with $169.3 million in liabilities, resulting in net assets of $147.8 million. This is a $28.1 million decline from prior year. While the association’s balance sheet continues to be strong, we did see significant unfavorable changes year over year in both assets and liabilities.
Within assets, our long-term investments balance decreased $20.8 million year over year, mainly driven by less investment income year over year. We utilized $13 million of investments to support operations and our membership value proposition but only had a modest investment gain for the fiscal year. While fiscal year 2019 (through Aug. 31, 2019) had a net investment return of only 2%, calendar year 2019 (through Dec. 31, 2019) had returns of nearly 18%.
Within liabilities, our pension liability increased $19.1 million year over year. The pension liability is largely a function of interest rates: the lower the interest rate, the higher the pension liability. Over the past few years, rising interest rates and loans used to fund the pension obligation reduced our total obligation. However, in fiscal 2019, we experienced falling interest rates as the U.S. 10-year Treasury rate declined to a three-year low of 1.5% at Aug. 31, 2019, which is our measuring date for the pension valuation. This resulted in our pension liability spiking in fiscal 2019 to close the fiscal year at $43 million.
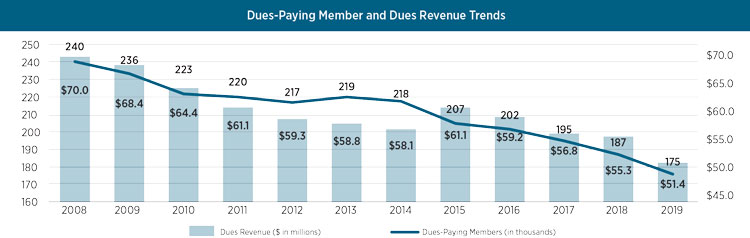
Chart by Sara Wadford
While a falling interest rate increases our pension liability, it also produces lower costs for borrowing. After fiscal 2019 concluded, the association entered into another borrowing transaction and contributed those funds to the pension plan to meet future expected contributions.
This loan did not increase the association’s overall liabilities but rather reduced the unfunded pension liability line item and increased the pension loan line item. The loan also had the benefit of reducing the overall interest rate on our outstanding pension loan and extending the repayment period.
Trends in general operations
In addition to focusing on results from current operations, it’s equally important to watch trends. Over my term as treasurer, here are some of the important trends we’ve been watching:
- General operations dues revenue and membership. The chart below shows the trend of membership and dues revenue. You will see over the last four fiscal years that dues attributable to general operations have declined from $59.2 million in fiscal 2016 to $51.4 million in fiscal 2019. Dues for fiscal 2020 were budgeted at $42 million, which is a result of the repricing strategy implemented to reverse the decline in membership. The decline in dues revenue is a trend that goes back to 2008, and the increased revenue shown in 2015 was the result of a dues rate increase. Note that dues revenue immediately began to decline in the year after the 2015 dues rate increase.
- General operations nondues revenue. Over the last four fiscal years, despite declining dues-paying members, our nondues revenue has remained relatively flat. This means that while the number of members declined, the use and engagement with nondues activities remained the same or increased slightly.
- General operations expense. On the expense side, our general operations expenses went from $103 million in fiscal 2016 to $87.5 million in fiscal 2019. Budgeted expense in the current fiscal year is $85.4 million. The significant expense reductions have come as a result in the reduction of personnel. Those reductions have been through a combination of shifting personnel out of general operations and a reduction in the workforce through our voluntary separation a year ago. Because approximately 80% of our general operations budget is people and space, further reductions are a challenge unless the association strategically changes what we do or how we do it. (See General Operations Expense graphic below.)
- General operations investment funding. Over my tenure, we’ve changed our spending policy. Initially, our policy allowed for up to 5.5% of investments to be used to support operations. However, watching the trend of overreliance on investments to support operations caused the Board of Governors to pass an updated policy in fiscal 2018, limiting investment spending for operations to no more than 3.5%. Additional amounts can be used for capital projects like the value proposition. The chart below shows the spending from investments from fiscal 2016 to present.
Fiscal 2021 budget and beyond
As we continue into the fiscal 2021 budget and beyond, we will continue to evaluate how dues and nondues revenues are progressing against our membership model. The value proposition is a multiyear effort. We know it will take time to communicate and demonstrate the enhanced benefits available to prospective members and for those prospective members to give us the opportunity to serve them. Therefore, we will continue to invest in the value proposition over the next four years.
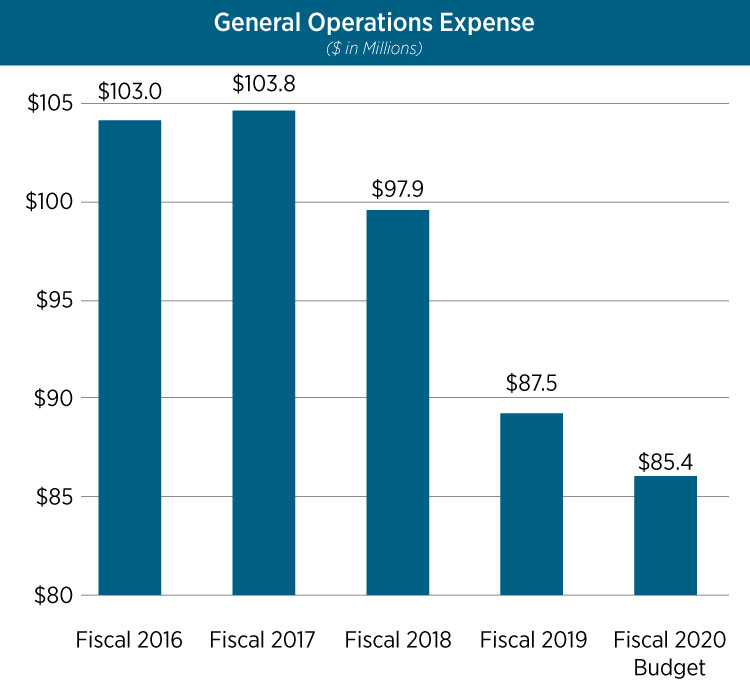
Chart by Sara Wadford
The budget process is undertaken each year to allocate resources for the next fiscal year. Over the last several years, our budgeting has focused on reducing expenses in light of the declining revenues. The amount of the cost reductions varied greatly from year to year. For fiscal 2021, to enhance strategic planning, the Finance Committee is working to incorporate a longer-term view of the budgeting process. Given that the value proposition is a multiyear effort with resources dedicated to the multiyear expenses, this is an ideal time to introduce this longer-term view for budgeting. We will still submit a balanced budget each year, but we’re looking longer-term to anticipate income and expenses and prepare accordingly.
In developing the model, we looked at all components of our operating budget. We considered both dues and nondues revenue projections through fiscal 2024. We also reviewed expense projections, including annual inflationary changes. To create a smoother, more equitable allocation of that budget gap, we then divided the gap over the four-year period of consideration. Using this approach, we have estimated the total annual budget task required through fiscal 2024. That said, we are constantly updating the process in light of new information resulting from the COVID-19 pandemic. As such, the fiscal 2021 budget will present more of a challenge than we originally anticipated as we work to make strategic decisions to reduce costs and limit the use of our resources.
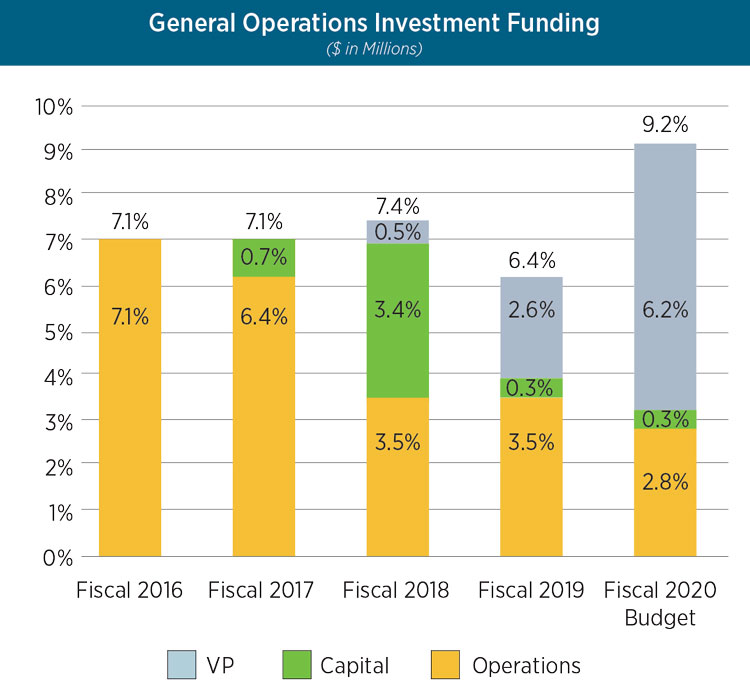
Chart by Sara Wadford
The association has resources both in financial and human capital. We must think critically as we deploy those resources to ensure that the association can carry on its work, which is critical to the legal profession and the judicial system. It is more critical than ever that we think strategically, listen carefully to what the market is telling us, analyze the trends and data, and then make strategic but bold decisions to propel this association forward.
Thank you for the opportunity to serve as your treasurer.
Correction
A table in print and initial online versions of the ABA Treasurer's Report should have indicated long-term investments of $296.5 million in 2018.The Journal regrets the error.